
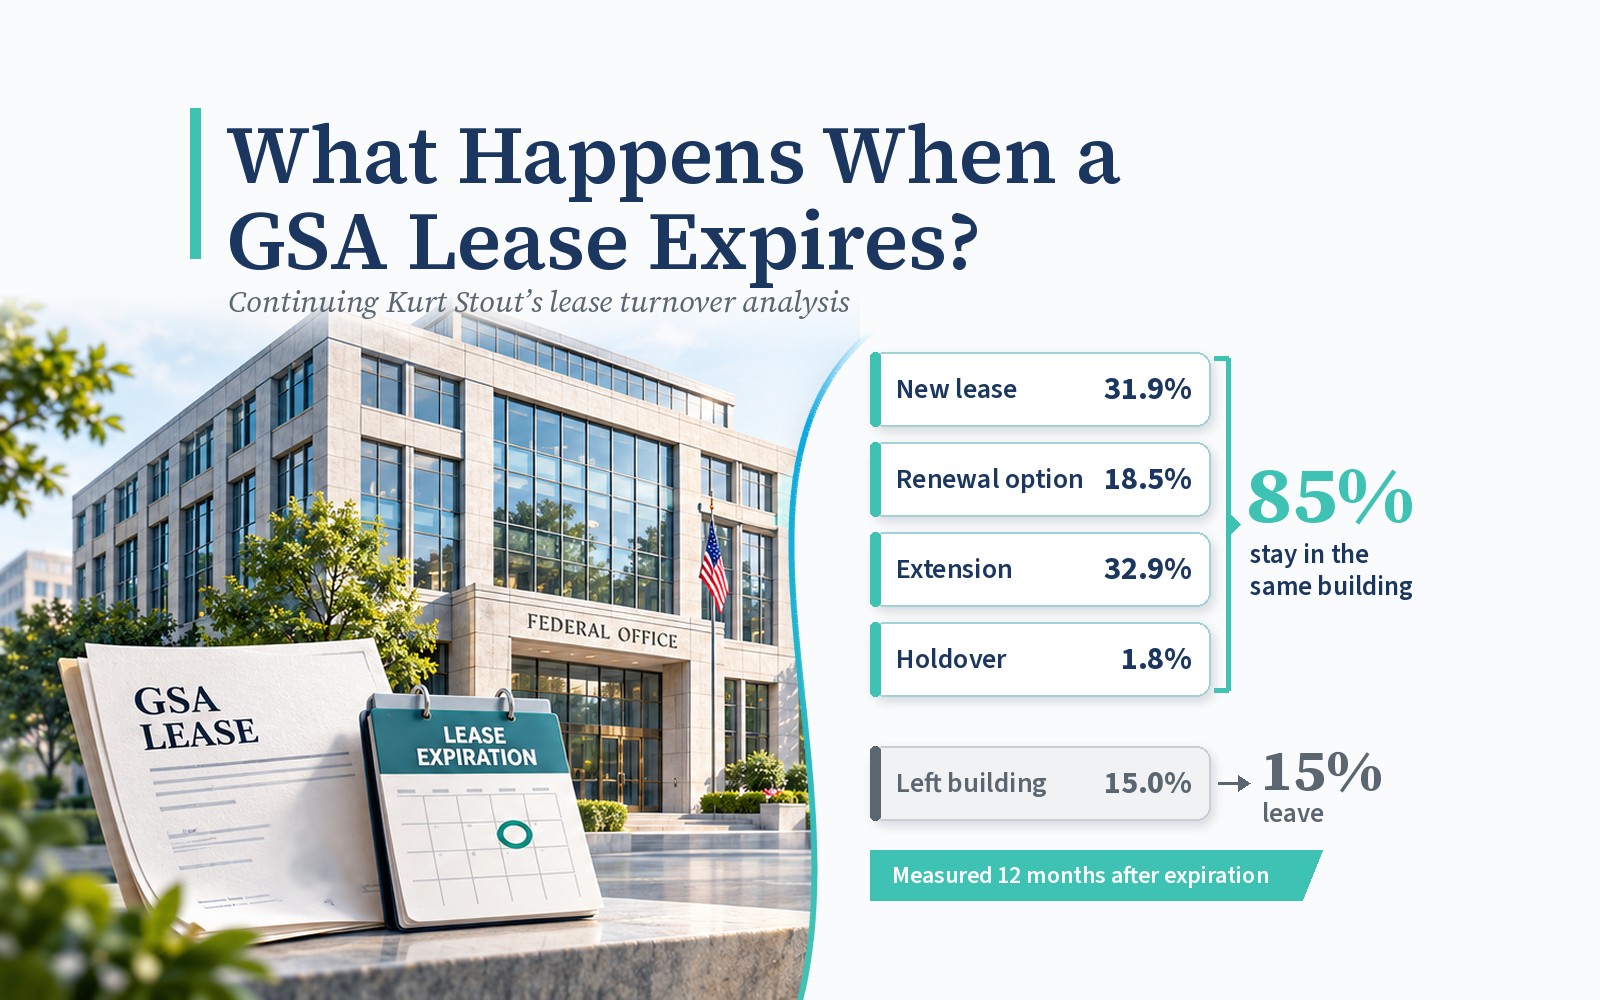
By Chad Becker, CCIM, Founder and Principal, ARCO Federal Leasing Advisors
Executive Summary
- GSA usually stays. From FY2014 to FY2024, 85% of expiring GSA leases were still in the same building a year after they expired. About 1 in 7 (15.0%) left the building.
- Expiration is the biggest single moment of risk. Early termination during the soft term is real but spread out. A lease entering a typical five-year soft term has about a 1 in 8 chance (13%) of being terminated before it expires, and the year the termination right opens is the riskiest single year.
- Holdover is a stage, not a verdict. Before 2025, about 1 in 10 expiring leases (10.0%) was still in holdover three months after expiration, and most of those ended with GSA staying. In FY2026 it was 1 in 4 (25.2%).
- The middle of the size range is the safest. Leases of 5,000 to 25,000 RSF were the least likely to leave at expiration. Leases under 5,000 RSF carry the most soft-term risk, and leases of 100,000 RSF and up were no safer at expiration than small ones.
- Full federal occupancy pays. In buildings the government fully occupies, about 1 in 9 expiring leases (10.7%) left, against about 1 in 6 (16.9%) where it holds under a quarter of the space.
- 2025 froze the market, but an announced termination is not a termination. New leasing fell by about 4 in 10 (41%) and holdovers nearly tripled. Of the leases put on the DOGE termination list and later rescinded, 95% were still in their buildings.
- GSA’s own headline number understated how often GSA stays. It counted a landlord who won a competitive re-procurement as having lost the tenant, and it counted holdovers as extensions.
What GSA used to publish
From FY2001 through FY2014, GSA published an annual Lease Turnover Analysis: a spreadsheet showing what happened to its leased portfolio during each fiscal year. GSA stopped after FY2014, and nothing has replaced it.
The report worked from two snapshots of GSA’s lease inventory, one at the start of the fiscal year (October 1) and one at the end (September 30). For every lease scheduled to expire during the year, it reported where the lease stood at year-end:
- Extended: GSA extended the existing lease.
- Renewed: GSA exercised a renewal option.
- Replaced in the same building: a new lease took its place in the same building.
- Moved to another leased building: the tenant relocated to other leased space.
- Terminated: the lease ended with no leased replacement. In later years GSA also noted why, for example a move into a federally owned building or an office closing.
The report also counted leases that were not scheduled to expire but ended early. That line was the industry’s only portfolio-wide read on soft-term terminations. From all of this, GSA calculated an annual turnover rate and projected how many years it would stay in its leased space. Every line was reported both by number of leases and by square feet.
Two things made the report valuable and are worth keeping in mind:
- GSA knew who the tenant was. Because GSA could see the agency behind each lease, it could say whether a departing tenant moved, went into federal space or closed. The public lease data available today does not name the agency, which shapes how this report describes a departure.
- It was the only published scorecard. For anyone who owns, finances or buys a GSA-leased building, it was the one place to see how often GSA stays, moves or terminates. GSA itself cautioned against basing portfolio or financing decisions on it, but the industry had nothing better.
How Kurt Stout read it
In March 2015, Kurt Stout, who led Colliers’ Government Solutions practice, published Some Thoughts About GSA’s Annual Lease Turnover Analysis. Working from GSA’s FY2014 edition, it was the best reading of GSA’s leasing data that had ever been publicly published for our industry. Kurt asked the questions owners actually wanted answers to. Will they leave at expiration? Will the lease get terminated during the soft-term?
His main takeaways:
- GSA stays more often than the headline suggests. GSA’s renewal probability for FY2014 was 77%: the share of space scheduled to expire that was still under GSA lease in the same building at year-end. Kurt argued the real odds for most owners were higher, because that average included leases already slated for consolidation, where the odds were near zero. He expected newer buildings to do better still.
- Most “renewals” were really extensions. About two-thirds of what GSA counted as renewals were extensions. With roughly a quarter of GSA’s leases expiring within two years, he expected GSA to keep extending to work through the backlog.
- Early termination is rare, and usually planned. Using GSA’s figures, he put the chance of a lease being terminated during a five-year soft term at almost 9%.
- Bigger leases are stickier. GSA projected it would stay in its larger leases much longer than its smaller ones. Kurt bet that bigger leases in buildings predominantly leased to federal tenants were especially sticky.
- More space was moving into federally owned buildings, more than 1 million square feet in each of FY2013 and FY2014.
Kurt was just as clear about what the data could not answer. Above all, GSA never broke out how the odds change with lease size.
Kurt has since passed away, and nobody has picked this analysis up since. In 2024 I was honored to receive the National Federal Development Association’s Kurt Stout Memorial Lecture Award. This piece is my attempt to live up to it.
How ARCO picked up the work, and why we changed the lens
I started my career in commercial real estate at GSA in 2002, and have represented landlords since founding ARCO Federal Leasing Advisors in 2017. ARCO has spent substantial resources building a database of every monthly GSA lease inventory since 2013. That investment of time and resources allowed us to rebuild GSA’s analysis from FY2014, when GSA stopped publishing, through FY2026. Then I carried Kurt’s questions forward, including the size breakdown he didn’t get a chance to address.
We did this in two steps.
Step 1: Rebuild GSA’s final report to learn its rules
GSA never published how it built its report. So before changing anything, we rebuilt GSA’s final edition, FY2014, from GSA’s own monthly lease files, testing definitions until our results matched. They match GSA’s published figures exactly: the starting inventory, the leases scheduled to expire, and the numbers extended, renewed and ended early (note 3). That told us how GSA defined each line. It also showed what two of its labels were hiding.
- “Extended” included leases that had not been extended. GSA counted every expiring lease still on its books at year-end as extended. In FY2014, about 3 in 10 of the leases GSA called extended (215 of 717) had not been extended past September 30. Most had expired that very day with nothing new recorded yet. The rest were already in holdover.
- “Moved to another leased building” included leases that never moved. When GSA re-procured a lease competitively and the same building won, the report counted it as a move. In FY2014, more than half of the leases GSA reported as moved (about 125 of 227) actually stayed in the same building. For the owner who won that re-procurement, GSA’s report recorded a lost tenant.
Step 2: Judge each lease at its own expiration
GSA’s report answers one question: where did each lease stand on September 30? An owner’s question is different: what happened when a lease expired? So for the purposes of this analysis, we look at every lease against its own expiration date, at two points:
- 3 months after expiration, an early read. By then GSA has recorded an action on most leases and generally accounts for any delayed reporting, so this point shows how many are still in holdover vs an alternative outcome.
- 12 months after expiration, the headline. By the 12 month point nearly every outcome has settled. Only 2% of leases are still in holdover, and waiting another year changes the share that left by about 1 point.
The outcome is whatever GSA last recorded on the lease: a new lease, a renewal option, an extension, a holdover, or nothing at all because the lease left the building. Finding 1 defines each one.
| GSA’s fiscal-year view | ARCO’s expiration view | |
|---|---|---|
| The question it answers | Where did the lease stand at the end of the fiscal year? | What happened when the lease expired? |
| Time allowed before a lease is judged | Depends on the date: about 11 months for an October expiration, none for a September 30 expiration | The same for every lease: 3 and 12 months after its own expiration date |
| Can one lease be counted twice? | Yes. A lease in holdover or on a short extension at year-end joins the next year’s group too | No. Each expiration date is judged once |
Why we believe the expiration view is more accurate:
- Every lease gets the same clock. Half of all September expirations fall on September 30, the day of GSA’s snapshot, and most of those show no outcome yet. Judged three months after their own expiration, September leases look like leases expiring in any other month. A lease’s outcome should not depend on where its date falls in GSA’s calendar.
- Each expiration counts once. Under GSA’s method, more than a quarter (28%) of each year’s expiring group in FY2015 to FY2024 had already been counted the year before.
- Most importantly, it answers the question owners actually want to know. An owner wants to know what happens to a lease when it expires, not where it stands at the end of GSA’s fiscal year.
What the new lens shows about GSA’s headline number
Kurt’s headline was GSA’s renewal probability. We recreated it with GSA’s own rules for every year since FY2014 and set it beside the expiration view. The two tell very different stories.
GSA’s number swung between 58% and 84%. At each lease’s own expiration, 83% to 88% stayed every year.
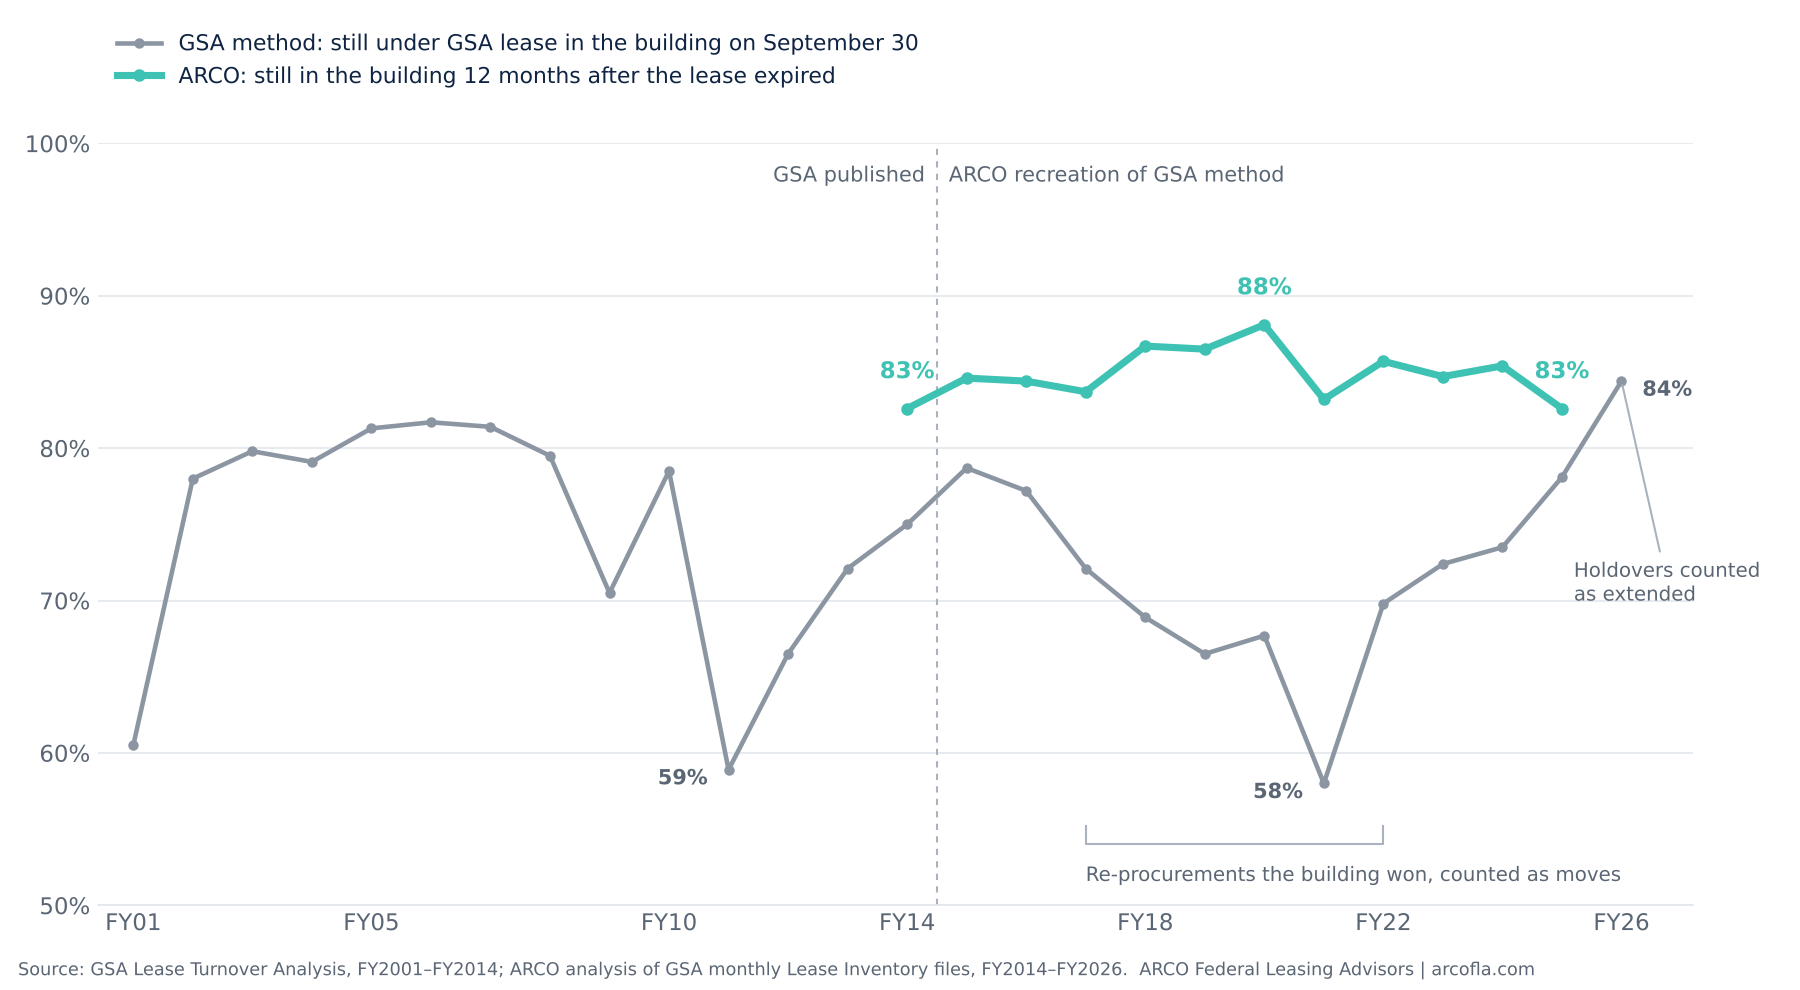
Share of expiring leases still in the same building. Both lines count leases; Kurt’s 77% was GSA’s square-foot figure. GSA’s line is as published through FY2014 and recreated by ARCO after that. ARCO’s line runs through FY2025, the latest year with a full 12 months of follow-up. The FY2011 and FY2021 lows also reflect temporary Census offices closing.
Source: GSA Lease Turnover Analysis, FY2001–FY2014; ARCO analysis of GSA’s monthly Lease Inventory files, FY2014–FY2026.
GSA’s number moved for two reasons that have nothing to do with owners keeping or losing tenants:
- The dip came from re-procurements the building won. Same-building competitive re-procurements grew from 6–8% of expiring leases in FY2014–FY2016 to 16–20% in FY2018–FY2022. GSA’s method counts each one as a move, which pulled its number down.
- The jump came from holdovers. As holdovers piled up in 2025 and 2026, GSA’s method counted them as extended, pushing its number to 78% and then 84%, the highest in its history.
Kurt suspected the real odds were better than GSA’s Lease Turnover Analysis presented. They were. From here on, every figure uses the lease expiration view and counts leases, not square feet (see “About the data”).
Finding 1: GSA stays in about 85% of expiring leases
From FY2014 to FY2024, 85% of expiring GSA leases were still in the building a year after expiration. Almost a third (32%) had a new lease, nearly 1 in 5 (19%) had an exercised renewal option, a third (33%) had been extended, and about 1 in 7 (15.0%) had left the building.
Every expiring lease ends up in one of five outcomes, based on the latest action GSA recorded on it:
| Outcome, 12 months after expiration | What it means for the owner | Share of expiring leases |
|---|---|---|
| New lease | GSA signed a new lease in the same building, whether succeeding, superseding or competitively procured. Most run 10 years or more. | 31.9% |
| Renewal option | GSA exercised a renewal option already in the lease, usually for 5 years at the pre-set rent. | 18.5% |
| Extension | GSA extended the existing lease. Most extensions are short (the typical one adds 2 years), so the decision comes back soon. | 32.9% |
| Holdover | The lease has expired and GSA is still there with no new term recorded. | 1.8% |
| Left the building | The lease ended and no new GSA lease took its place in the building. | 15.0% |
FY2014–FY2024 expirations, 12,755 leases. Excludes leases in buildings owned by the U.S. Postal Service and temporary 2020 Census offices (notes 1 and 2). Every share is measured 12 months after expiration.
What this means for an owner:
- A new lease is the long-term answer, whatever its length. It resets the clock on the building for a decade or more. A renewal option buys about five years. An extension usually just moves the same negotiation a year or two down the road.
- Before 2025, GSA was moving toward long-term answers. New leases and renewal options rose from 44% of expirations in FY2014 to 68% in FY2024, while extensions fell from 37% to 15% of expirations. For owners, that meant fewer repeat negotiations and more years of committed rent. 2025 interrupted that trend (Finding 5).
- Holdover is common early and rarely the end of the story. Three months after expiration, about 1 in 10 expiring leases (10.0%) is still in holdover. By the 12-month mark shown in the table above, only 1.8% are, and most of those holdovers ended with GSA staying in the building. Holdover carries somewhat more risk, but more than anything it signals a slow process, not a departure.
- About 1 in 7 expiring leases (15.0%) left the building. GSA’s public inventory does not name the tenant agency, so it cannot say where a departing tenant went. For an owner however, what really matters is that the lease / tenant left.
Finding 2: Early termination is a real risk, spread across the soft term
At FY2014–FY2024 rates, a lease entering a five-year soft term has about a 1 in 8 chance (13%) of being terminated before it expires. The soft term is the time after the firm term when GSA can end the lease by providing written notice.
Picture 1,000 GSA leases entering a five-year soft term. In the first year, when the termination right opens, about 34 are terminated (3.4%). In each of the next four years, about 24 to 25 more are terminated (about 2.6% a year). By expiration, about 130 are gone and about 870 are still in place.
Kurt estimated almost 9%. He started from GSA’s own yardstick, which divides by every lease not expiring that year, including leases still in their firm term and leases with no termination right at all. Measured directly, counting only leases GSA could actually terminate, the risk is somewhat higher.
What this means for an owner:
- These are deliberate decisions. About 7 in 10 first-year terminations (69%) happened within three months after the termination right start date. The year the right opens is the riskiest single year of the soft term.
- The first soft year got riskier before DOGE. The first-year rate ran 4.8% in FY2014–FY2015, fell to 2.4% in FY2016–FY2021, and returned to 4.6% in FY2022–FY2024. That is a return to earlier levels, not a new high.
- The risk is not the same for every lease. It is highest for small leases and in buildings where the government holds a small share of the space (Findings 3 and 4).
- Year for year, expiration is the bigger event. In any single year of the soft term, about 2 to 3% of leases are terminated. At expiration, about 15% leave.
Finding 3: Lease size changes the odds, and the middle is safest
Leases of 5,000 to 25,000 RSF were the least likely to leave at expiration, about 12 to 13%. Smaller and larger leases left at 16 to 17%.
| Lease size (RSF) | Left the building, 12 months after expiration | In holdover, 3 months after expiration | Chance of termination over a five-year soft term |
|---|---|---|---|
| Under 5,000 | 17.1% | 8.7% | 17% |
| 5,000–10,000 | 13.2% | 8.7% | 10% |
| 10,000–25,000 | 12.2% | 10.4% | 9% |
| 25,000–50,000 | 16.9% | 13.2% | 11% |
| 50,000–100,000 | 16.0% | 13.9% | 9% |
| 100,000 and up | 17.4% | 16.2% | 15% |
| All leases | 15.0% | 10.0% | 13% |
FY2014–FY2024 expirations, same exclusions as Finding 1. The gap between mid-size leases and the rest is larger than the margin of error, which runs from about ±1 point for small leases to about ±4 points for the largest; small differences between neighboring rows are not. The 100,000 RSF and up soft-term figure rests on few cases (8 first-year terminations among 124 leases).
What this means for an owner:
- A U-shape risk profile at expiration. Mid-size leases are the most likely to stay. The difference is real but modest: about 1 in 8 mid-size leases left (12 to 13%), against about 1 in 6 on either side (16 to 17%).
- Holdover rises with size, from about 9% under 10,000 RSF to 16% at 100,000 RSF and up. Big leases can take longer to resolve, and the data supports that owners of large GSA leases should expect, and be prepared for, a longer holdover.
- Soft-term risk is highest for small leases. Leases under 5,000 RSF carry about a 17% chance of termination over five years, against 9 to 11% for most larger sizes.
- The largest leases are not the stickiest at expiration. Kurt had previously found that larger leases stay longer, and per year they do, mostly because they run longer terms and so reach expiration less often. But when a 100,000+ RSF lease does reach expiration, it is no safer than a smaller one. About 17% left within a year, against 12 to 13% for leases of 5,000 to 25,000 RSF. This finding was truly shocking and runs contrary to the anecdotal understanding that persists in our niche market.
Finding 4: Full federal occupancy keeps leases
Whereas the finding above regarding the largest leases not being the “stickiest” at expiration was a bit surprising, the finding related to GSA occupancy percentage was more in alignment with market expectations. Buildings the government fully occupies retain leases the best, both at expiration and in the soft term. About 1 in 9 expiring leases (10.7%) left a fully federal building, against about 1 in 6 (16.9%) where the government holds under a quarter of the space.
| Federal share of the building | New lease, 12 months after expiration | Left the building, 12 months after expiration | Chance of termination over a five-year soft term |
|---|---|---|---|
| 100% | 39.5% | 10.7% | 9% |
| 75–99% | 33.1% | 14.5% | 9% |
| 50–74% | 32.7% | 14.6% | 12% |
| 25–49% | 32.4% | 14.8% | 12% |
| Under 25% | 29.4% | 16.9% | 15% |
FY2014–FY2024 expirations. Federal share adds up every GSA lease in the building. About 1 in 6 expiring leases (16%) has no reported share and is left out here.
What this means for an owner:
- Fully federal buildings win on every measure. More of their expiring leases end in a new long-term lease, fewer leave, and fewer are terminated early.
- It is not just a size effect in disguise. Comparing leases of similar size: from 5,000 to 100,000 RSF, a fully federal building lost about 1 expiring lease in 11 (8.9%), against about 1 in 6 (15.6%) where the government holds under half the space. Under 5,000 RSF there is little difference (16.9% vs. 18.3%); small offices leave at similar rates wherever they sit. At 100,000 RSF and up, the gap is 15.0% vs. 19.4%, on a small sample.
Finding 5: 2025–2026, the year nothing moved
In 2025, GSA signed far fewer new leases and cleared fewer holdovers, and the soft-term terminations it did make fell mostly on small leases. Meanwhile, most of the terminations announced on the DOGE tracker never happened.
- New leasing fell by about 41%. 362 new leases entered GSA’s inventory in FY2025, against about 611 a year in FY2014–FY2024 (41% fewer). FY2026 recovered only partly, to 418.
- Holdovers piled up. In FY2026, 1 in 4 expiring leases (25.2%) was still in holdover three months after expiration, against 1 in 10 (10.0%) before 2025. The number of leases in formal holdover nearly tripled, from 60 in September 2024 to a peak of 197 in June 2026, and closed September 2026 at 165, the highest year-end level in the series.
- Yet departures at expiration rose only modestly. 17.4% of FY2025 expirations left the building within a year, against 15.0% normally. The exit was stalled, not avoided.
- Soft-term terminations doubled, almost entirely through DOGE’s list. 5.3% of leases already in their soft term were terminated in FY2025, against 2.6% normally. 77 of those 120 terminations were small leases that stayed on DOGE’s termination list. Outside the list, the FY2025 rate was 2.0%, below normal. FY2026 eased to 3.5%.
- Small leases took the hit. Under 5,000 RSF, 9.6% of leases already in their soft term were terminated in FY2025, almost three times the norm (3.4%).
Leases in holdover nearly tripled, from 60 in September 2024 to 165 in September 2026
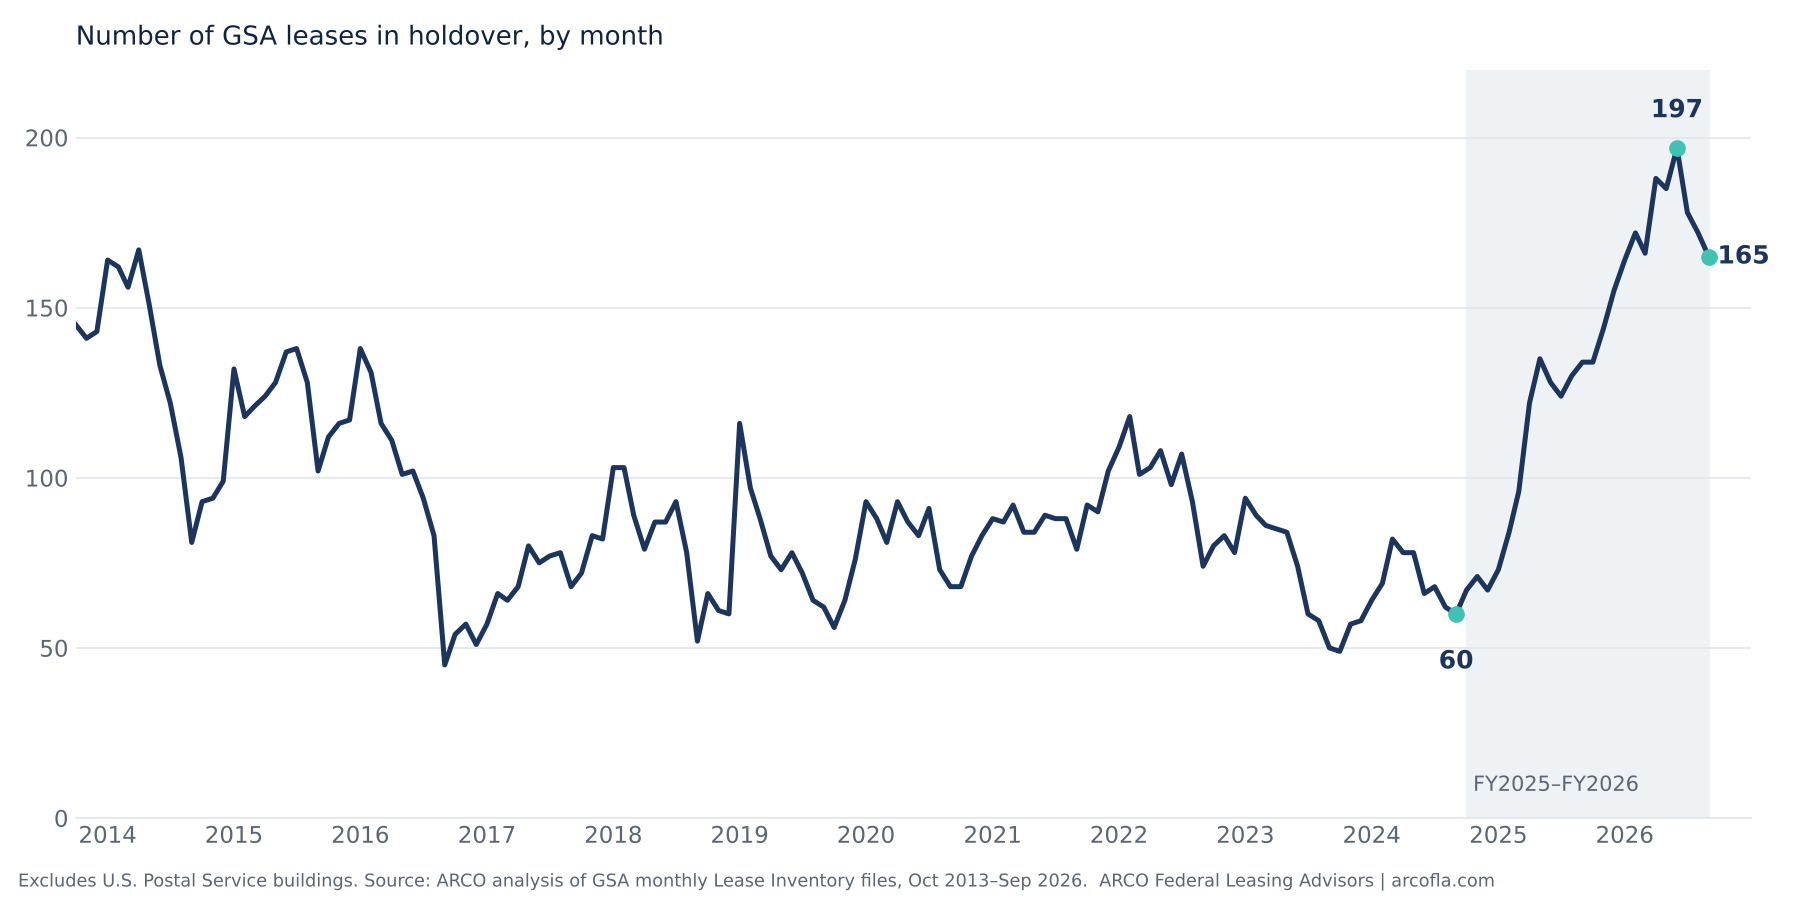
Number of GSA leases whose latest action is Holdover, by month. Excludes U.S. Postal Service buildings (note 1).
Source: ARCO analysis of GSA’s monthly Lease Inventory files, October 2013–September 2026.
An announced termination is not a termination. The DOGE tracker turned into a natural experiment. Of 261 leases that stayed on the termination list, 87% were gone by September 2026. Of 595 leases announced and later rescinded, 95% were still occupied by the government in the same building, close to the 97% for leases never on the list. And 90% of the savings claimed on the tracker ($512 million of $565 million) sat on leases that were later rescinded.
The context behind these numbers
The years this analysis covers were anything but ordinary for federal leasing. Over that span, the market absorbed:
- Reduce the Footprint, which began during the Obama administration but shaped federal leasing for years after President Obama left office.
- The Lease Cost Avoidance era, GSA’s push to bring down what it pays to lease.
- COVID-19, and with it a structural shift toward working from home.
- 2025, which brought DOGE, mass layoffs at GSA and other agencies, and return-to-office mandates across the government, often pulling in opposite directions.
No period is free of volatility, but the only thing missing here was a plague of locusts. We intentionally did not try to separate the effect of each factor above. The point is simply that every number in this report was produced through all of it. That makes the steadiness of the core finding worth noting. In every year from FY2014 to FY2025, between 83% and 88% of expiring leases were still in the building a year after they expired. While the top-line figure stayed steady, I would speculate that the outcomes represented in the segments that make up that figure fluctuated far more. But that’s another topic for another time.
What are the main takeaways for owners of GSA-leased properties?
The data points to four practical moves for an owner with a GSA lease.
- Treat expiration as the main event. About 1 in 7 expiring leases (15.0%) leaves the building, against about 2 to 3% a year of terminations during the soft term. Start positioning for the next deal well before the lease expires, and mark the year the termination right opens, the riskiest year of the soft term.
- Know your risk profile by size. Leases under 5,000 RSF carry the most soft-term risk (17% over five years). Leases of 5,000 to 25,000 RSF are the least likely to leave at expiration (12 to 13%). Above 25,000 RSF, about 1 in 6 leaves at expiration (16 to 17%), and holdover is more common.
- Underwrite holdover as normal. Before 2025, about 1 in 10 expiring leases (10.0%) was in holdover three months later. In FY2026 it was 1 in 4 (25.2%). Budget time and cash flow for months in holdover, and keep the paperwork moving.
- Value full federal occupancy. Buildings the government fully occupies lost about 1 lease in 9 at expiration (10.7%). Their five-year soft-term risk was also lower, about 9%, compared with 15% where the government holds under a quarter of the space.
Putting the two risks together. Of leases entering a typical five-year soft term, about 13% are terminated before expiration, and about 15% of the rest leave at expiration. Taken together, roughly 1 in 4 (26%) leases are gone within a year of their original expiration date, and about 3 in 4 stay through at least one more lease decision.
About the data
ARCO’s analysis covers all 26 fiscal years in GSA’s original format, plus the owner-focused cuts behind every number in this report.
- What we counted. Every figure counts leases, not square feet. An owner’s question is whether their lease stays, and a handful of very large leases can swing a square-foot total.
- Where the data comes from. GSA’s monthly Lease Inventory files, January 2015 to September 2026, plus ARCO’s copies of the January 2013 to December 2014 files. GSA’s FY2001–FY2014 figures are shown as GSA published them. Fiscal years run October through September. FY2026 results are preliminary.
- How a lease is judged. Each expiring lease is checked 3 and 12 months after its own expiration date, using the latest action GSA recorded on it. A lease is in the same building when it carries the same GSA Location Code. The street address is used only when GSA modified a building’s Location Code. A lease that takes a short extension and expires again within the year is counted once, with the first expiration recorded as an extension. A lease that drops out of GSA’s files for a few months and then reappears is treated as never having left.
- What “left the building” does and does not mean. It asks whether this lease continued, not whether the building later found another GSA tenant. In about 2% of expirations, the new lease in the building is a very different size and the building has other GSA leases, so it may be another agency moving in. We count those as a new lease, since GSA still occupies the building.
- Caveat. This is not investment, legal or financial advice. GSA cautioned against basing portfolio or financing decisions on its own report, and the same applies here.
Notes
- U.S. Postal Service buildings. We exclude GSA leases where the U.S. Postal Service is the landlord. These are GSA spaces inside post office buildings, 33 of them in September 2026, under 0.5% of GSA’s leases. GSA carries many of them in rolling holdover for years, so they made up about a third (31%) of all GSA holdovers in FY2014–FY2024. They are not a private owner’s risk, and including them would overstate holdover for everyone else.
- 2020 Census offices. We exclude 235 temporary offices leased for the 2020 Census. They were designed to close, and 94% did. GSA set Census years apart in its own reports.
- How we checked our rebuild of GSA’s FY2014 report. Our rebuild matches GSA’s published FY2014 figures exactly: 8,729 leases at the start of the year, 1,550 scheduled to expire, 717 extended, 172 renewed and 173 non-expiring leases that ended early. For GSA’s “moved” line: 661 expiring leases were gone from GSA’s files by year-end, and GSA reported 274 replaced in the same building, 227 moved and 160 terminated. In GSA’s files, 279 had a succeeding or superseding lease in the same building, 129 had a competitively procured replacement lease in the same building, and 253 had no new lease there. Counted as replaced in the same building, the 129 would make that line 408 leases, against GSA’s 274. Counted as terminated, they would exceed GSA’s whole terminated line in square feet. Only “moved” fits. Reviewed one by one, at least 120 of the 129 clearly stayed in the same building.
Sources
- Kurt Stout, Some Thoughts About GSA’s Annual Lease Turnover Analysis (Colliers, March 2015)
- GSA, Lease Turnover Analysis FY2001–FY2014 (Internet Archive copy)
- GSA, Historical Lease Turnover Totals (Data.gov record)
- GSA, Current Lease Inventory (Data.gov record): GSA’s monthly Lease Inventory files, January 2015–September 2026, plus ARCO’s copies of the January 2013–December 2014 files
- ARCO’s archive of the DOGE lease-termination tracker
About the Author
Chad Becker, CCIM, is the founder and principal of ARCO Federal Leasing Advisors, an independent firm that represents building owners exclusively in lease transactions with the U.S. federal government. He has worked in federal leasing since 2002. His federal career includes several positions at the U.S. General Services Administration and four years in overseas leasing as a civilian employee of the U.S. Navy. He is one of a small group of instructors who teach GSA’s mandatory Lease Acquisition Training. He received the National Federal Development Association’s Kurt Stout Memorial Lecture Award in 2024 and serves on its Executive Committee. He has been interviewed by the U.S. Government Accountability Office on federal real property, including as the association’s representative for GAO-26-107968, and has been quoted by CNN, the Associated Press and Bisnow.